View Job Run Logs
Job Run Logs
This section details the variety of ways that job run logs can be accessed depending on your Vydon environment.
Docker Compose
If you're running the docker compose setup or just trying out Vydon locally, there is currently no option within the UI to view logs.
To see these logs, you'll need to tail the running Vydon worker container.
If you ran make dev from the root, you can run the following command in your terminal:
docker compose -f compose.dev.yml logs -f worker
Or use make dev/logs to stream logs from every container in the stack.
An alternative is to use the docker command directly, or navigate to the vydon worker container in Docker UI.
docker logs vydon-worker -f
Kubernetes
If you're running in a Kubernetes environment, there are multiple ways to view worker logs, along with support for showing them natively in Vydon's UI.
kubectl
The standard way of viewing the live pod logs:
kubectl logs -n vydon deployment/vydon-worker -f
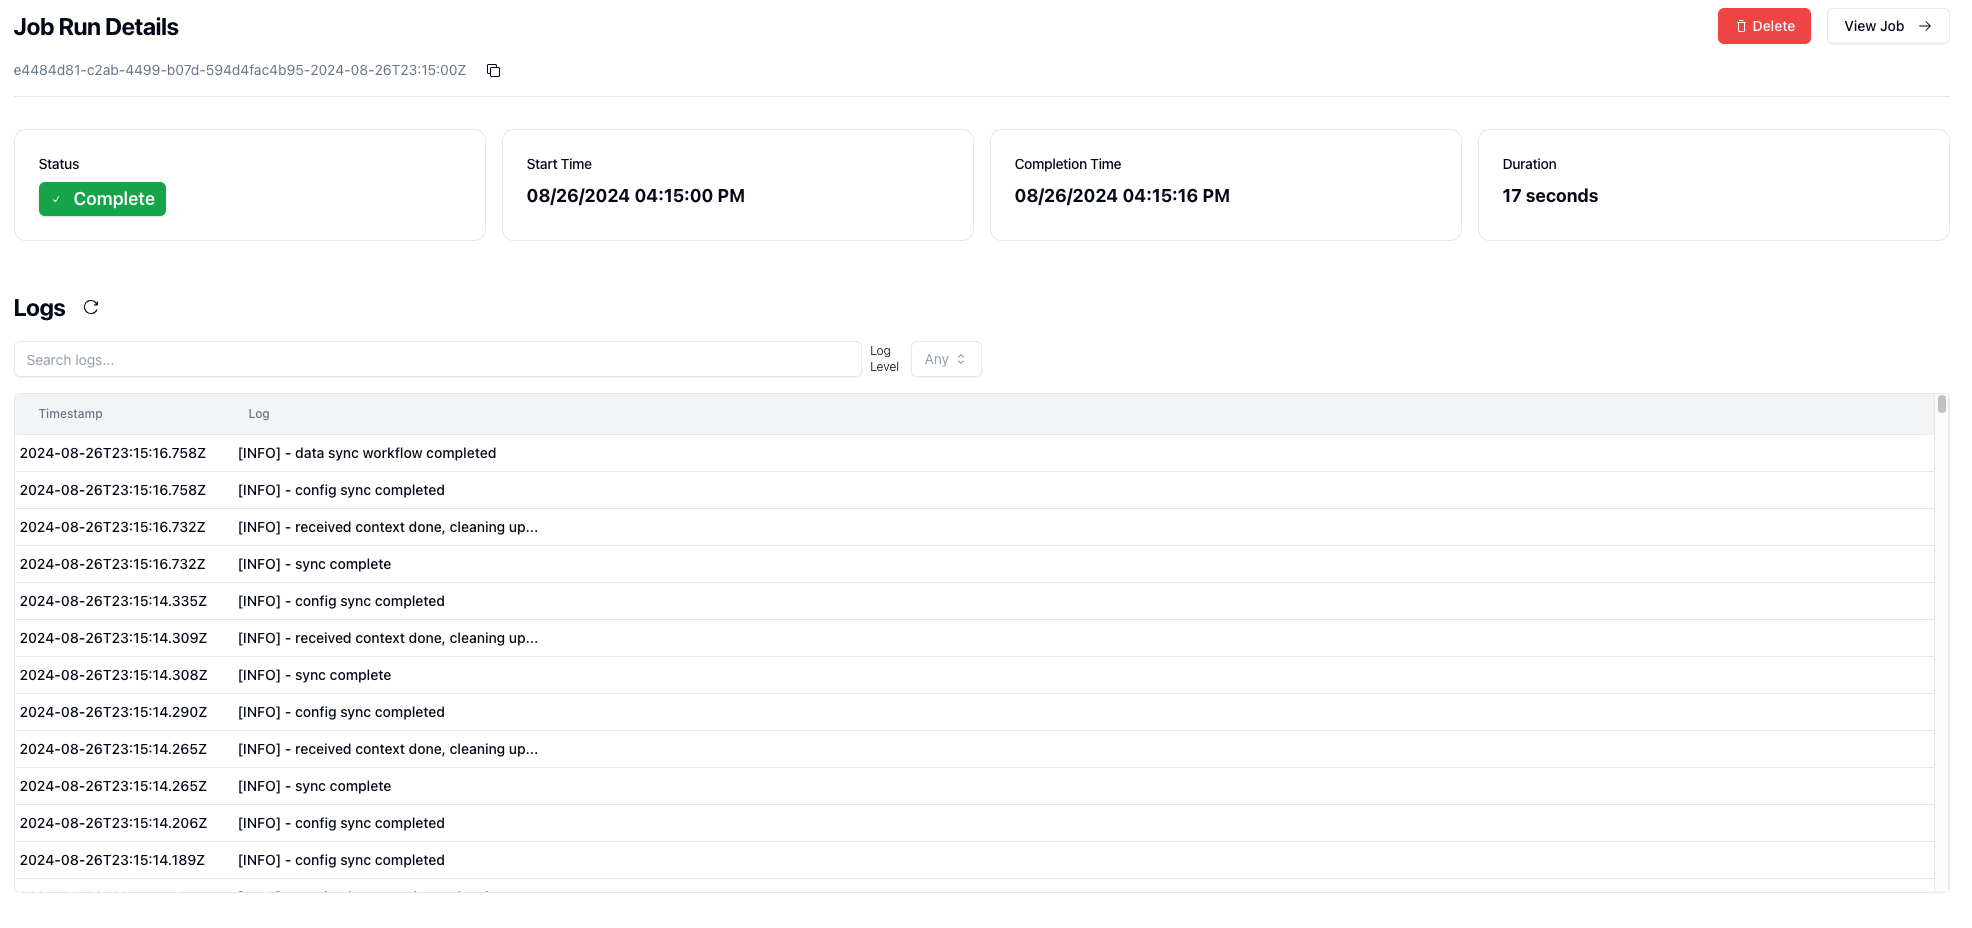
Vydon UI
Note: in-UI pod log surfacing was previously gated behind the enterprise build. It has been removed from the OSS codebase as part of the MIT compliance work and will be reimplemented natively in a future release.
Persistence with Loki
Note: the previous Loki integration was gated behind the enterprise build and has been removed from the OSS codebase. Until a native OSS Loki path is reimplemented, you can still ship worker logs to Loki out-of-band (Promtail, Vector, the Docker logging driver, etc.) and browse them in Grafana.
For the current set of RUN_LOGS_* environment variables exposed by the API, see api env vars.